Top 5 Ways to Avoid Data Analysis Paralysis

Have you and your team found yourselves in data overload, staring at endless charts, graphs, and tables? Has it stopped you from spotting real gaps and needs? You may be experiencing Data Analysis Paralysis! There is no one-size-fits-all Comprehensive Needs Assessment template. But the good news is that the Four Measures of Data model can help you slice through the chaos by identifying student outcome gaps, resource inequities, and root causes to inform evidence-based interventions.   

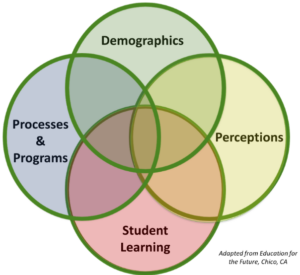
Victoria Bernhardt introduced the model in her 1998 book Data Analysis for Comprehensive Schoolwide Improvement and refined it in works like her 2000 article “Multiple Measures.” It is designed for practical use in schools, predicting actions that meet all students’ needs by categorizing data into four types – Demographics, Perceptions, Student Learning, School Processes –  and intersects them for quick, actionable insights.

Let’s dive into the Top 5 Ways this model keeps your Comprehensive Needs Assessment (CNA) moving forward!

1. Narrow Your Focus With Demographics

Identify the “who” of your school community to provide context for everything else. Without knowing contextual details – enrollment, ethnicity, socioeconomic status, mobility rates, subgroups, etc. – you might misinterpret trends. Are low achievement scores stemming from instruction? Or could it be high mobility rates? Spotlighting your demographics early can avoid deep dives into irrelevant metrics, and intersecting them with other measures can help uncover disparities. Tips for Avoiding Data Analysis Paralysis: Start with the Demographics measure to narrow your scope. Focus on 2 to 3 subgroups instead of all the data at once.

2. Capture the Human Element With Perceptions

Qualitative data from surveys, interviews, focus groups, or observations captures the “emotional pulse” of students, parents, staff, and community and can explain why you see a dip in quantitative data such as chronic absenteeism. Analyzing perceptions and intersecting them with other measures prevents data silos by humanizing the numbers, a quick way to cut through assumptions. Tips for Avoiding Data Analysis Paralysis: Limit your surveys and feedback to 10-15 questions. Intersect the results immediately with the Demographics measure to spot barriers.

3. Gauge Outcomes with Student Learning

Focusing on trends and multi-year views in academic outcomes like test scores, grades, growth metrics, proficiency rates, and graduation data prevents overreaction to anomalies. Measuring the data alone can be misleading but intersecting them with other measures adds depth. Tips for Avoiding Data Analysis Paralysis: Focus on trends and avoid raw data dumps. Prioritize ESSA metrics or State Accountability metrics first.

4. Unpack “How” with School Processes

Analyzing how your school runs on a day-to-day basis will help to identify controllable issues, shifting problems to solutions. The data includes operational details such as curriculum delivery, instructional strategies, professional development effectiveness, and interventions. Intersecting school processes with other measures shifts the analysis from “what’s wrong” to “how can we fix it” if you prioritize controllable factors. Tips for Avoiding Data Analysis Paralysis: Use flowcharts to map your school processes. Start by intersecting School Processes with one other measure, then build incrementally.

5. Intersect the Four Measures for Prioritized Needs

The power of the model lies in intersections – crossing measures gives a holistic view of patterns to uncover needs and predict actions. It reveals the “why” behind the “what.” Tips for Avoiding Data Analysis Paralysis: Start simple by pairing any two measures to build a basic picture. Then add a third measure for context to explain why a need exists. The ultimate intersection of all four measures during your data analysis will surface needs to prioritize in your improvement plan.

What does intersection mean?

It is the process of combining or crossing data from two or more of the Four Measures to reveal deeper relationships, root causes, patterns, and predictive insights that aren’t visible when examining each measure in isolation.

Picture This: An Example Scenario Using the Four Measures of Data

The leadership team at a middle school is beginning their Comprehensive Needs Assessment for the upcoming school year. Math scores are lagging, but they need to analyze the data to pinpoint why and plan interventions. They decide to review data in each measure.

  • Demographics: 60% of students are low-income, 25% of students are English Learners, 15% mid-year student population turnover (high mobility).
  • Perceptions: Surveys reveal 40% of students feel math classes are “boring” or “too hard,” with parents noting inconsistent homework support.
  • Student Learning: State assessments indicate 45% proficiency in math with English Learners at 30% and no growth in subgroups.
  • School Processes: Lesson observations show varied teaching methods with some teachers using interactive technology while others rely mainly on lectures.

The team intersects Demographics with Student Learning, revealing that low-income English Learners have the lowest math growth, suggesting barriers. By adding Perceptions to the intersection, it is revealed that this group of students report feeling “left behind” in surveys, linking Demographics to disengagement. They then layer in undifferentiated math instruction from School Processes. The need is apparent – lecture based math instruction does not meet the needs of this group of students, predicting continued gaps without change. The team predicts that targeted teacher professional development on differentiated math instruction could boost proficiency for at-risk groups. They identify two top priorities for their improvement plan – math PD and family workshops. They will allocate their federal funds for resources they need for the priorities, checking off compliance with ESSA. 

The Four Measures of Data model isn’t fancy – it’s practical for Avoiding Data Analysis Paralysis and nailing the CNA! The Plan4Learning software handles the heavy lifting by integrating the Four Multiple Measures in the CNA process. If you would like to learn more about our improvement planning software for schools, districts, and states, please give us a call at 877.331.6160 today or email us at sales@806technologies.com.

Need Customized Professional Learning?

Our team of certified educators have walked in your shoes. We understand your challenges and career aspirations. We are experts in the professional learning field with extensive school administration experience. If you don't see a professional learning offering that you're interested in, CONTACT US! We would love to develop a custom training that meets your exact needs.

Contact Us